Plasma Diagnostics
The research in the field of plasma diagnostics is focused on absolute density measurements of active species (OH, O, O3, Arm) in cold plasmas by means of laser spectroscopy. Spectroscopic techniques are also applied to determine electron temperature, electron density, rotational and vibrational temperature in plasma and the plasma afterglow. Different plasma diagnostics tools are available:
- Rayleigh scattering spectroscopy
- Laser-induced fluorescence spectroscopy
- Optical emission spectroscopy:
- UV/VUV optical emission spectroscopy with absolute calibration
- FTIR spectroscopy: absolutely calibrated, in-situ measurement optical bench
Rayleigh scattering spectroscopy
This technique is used to determine the gas temperature and the gas dynamics.
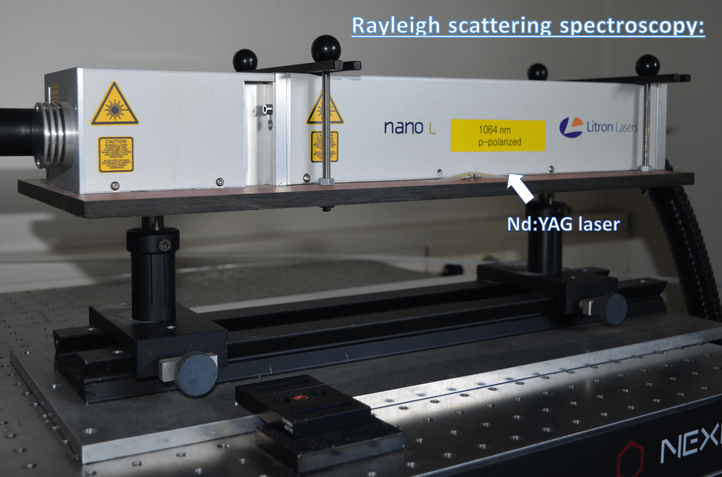
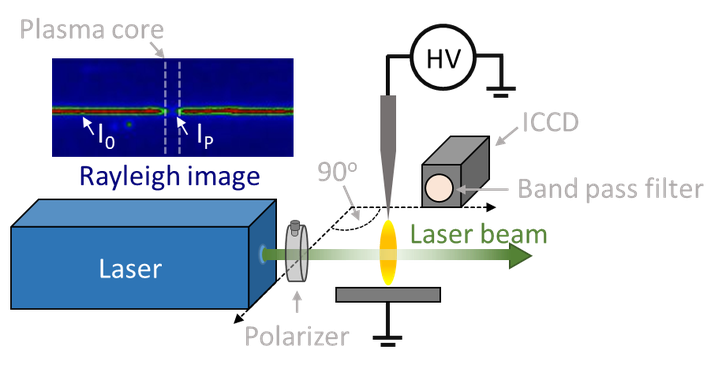
Rayleigh scattering spectroscopy is an active diagnostic technique that is based on the elastic scattering of electromagnetic radiation by particles, which have a size less than the wavelength of the source. For plasma diagnostics, the method is used for gas temperature and gas dynamics measurements. In our lab, we use ~10 ns laser pulses at a wavelength of 532 nm and monitor the Rayleigh signal by employing an intensified charge-coupled device(ICCD) camera coupled with a 532 nm band pass filter to eliminate the background signals generated in the plasma. Our facilities allow measuring gas temperature/dynamics with nanosecond temporal (~10 ns) and micrometer special (2D maps, 1 mm from the interfered objects) resolution.
Facilities:
Laser: Litron nano‐S (10 Hz)
ICCD camera: Hamamatsu digital camera
Digital delay generator(DDG): Stanford Research DG535 delay generator
Figure. Schematic representation of Rayleigh scattering spectroscopy
Laser-induced fluorescence spectroscopy
This technique is used to determine the kinetics and concentration of short-lived species (radicals, atoms): OH, NO, CH, NH, N2(A), C2(a), O, N, H, NH3, CH3.
Laser-induced fluorescence (LIF) is a powerful method that allows investigating the concentration of species in gas and liquid phases. The method involves the excitation of a molecular or atomic target by a monochromatic and coherent electromagnetic radiation, i.e., laser radiation, followed by detecting the subsequent spontaneous emission signal away from the excitation wavelength. The detection of species whose excitation energy corresponds to a deep ultraviolet wavelength can be performed using a two-photon excitation process. This method is called two-photon laser-induced fluorescence (TALIF) spectroscopy. In our lab, we use LIF and TALIF spectroscopies to study the gas phase kinetics of short-lived species involved in different plasma-driven chemical processes, including N2-fixation, CO2-reforming, H2 and hydrocarbons (olefins) synthesis whit nanosecond time- and micrometer space-resolution. Moreover, these methods can be used for gas temperature determination by scanning the emission profile of the investigated transition, using line broadening (for atoms) or Boltzmann methods.
Facilities:
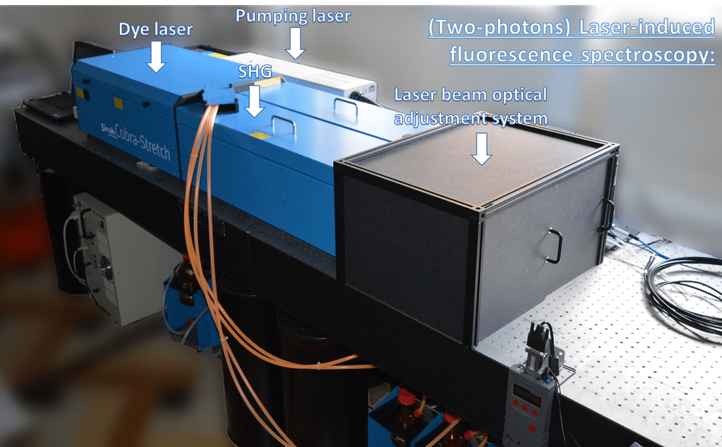
Laser: Pumping laser (355 or 532 nm) – Quantum-Ray Lab- Series pulsed Nd:YAG laser; dye laser – Sirah
Dye laser - Sirah Cobra - Stretch dye laser with a second harmonic generation unit
ICCD camera: Hamamatsu digital camera
DDG: Stanford Research DG535 delay generator
Wavelengh meter: Wavelength Meter Ångstrom WS Ultimate
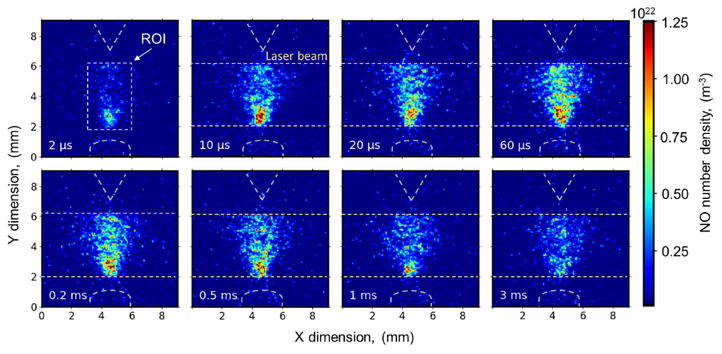
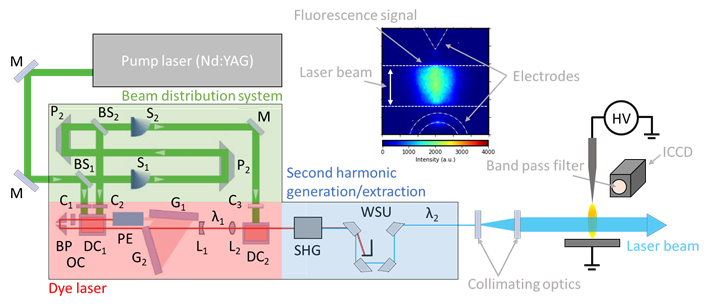
Figure. Schematic of LIF spectroscopy systems with a detailed drawing of an optical set-up of a dye laser with additional amplification and second harmonic generation (SHG) units: M – mirror; P – prism; C – cylindrical lens; S – beam shutter; PE – prism expander; DC – dye cell; BP – polarizing Brewster plates with 180° turning prism; G1 and G2 are grating and mirror/grating used for wavelength tuning; L1, L2 – telescopic lenses for focusing the laser beam on DC2; WSU – wavelength separation unit; λ1 and λ2 are the main and second harmonic wavelengths, respectively.
Optical emission spectroscopy
This technique is used to determine the gas composition, gas temperature, rotational and vibrational temperatures of electronically excited states, the reduced electric field, the electron density, and electron temperature.
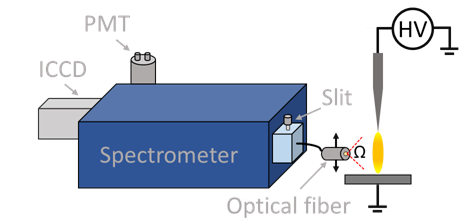
Optical emission spectroscopy (OES) is the main diagnostic technique for determining different essential plasma parameters. OES is a passive diagnostic technique that detects spontaneous emission signals from electronically excited species generated in plasmas. The emission signal collected by an optical fiber is directed to a monochromator grade, where it is decomposed into an emission spectrum. Consequently, the spectrum is registered using an ICCD camera or a photomultiplier tube (PMT). The optical emission spectra are used to monitor gas phase composition and can be calibrated in absolute units using emission reference signals or a collisional radiative model. Moreover, the spectra can be analyzed in terms of line intensities for temperatures and reduced electric field determination, and line broadening for electron density and temperature estimations. In our lab, we are able to measure optical emission spectra with nanometer temporal- and millimeter spatial resolution.
Facilities:
Spectrometer: Omni-λ 750i Monochromator and Spectrograph
Camera: Andor iStar 740 intensified charge-coupled device
PMT: type PMTH-S1-CR131, Zolix
DDG: Stanford Research DG535 delay generator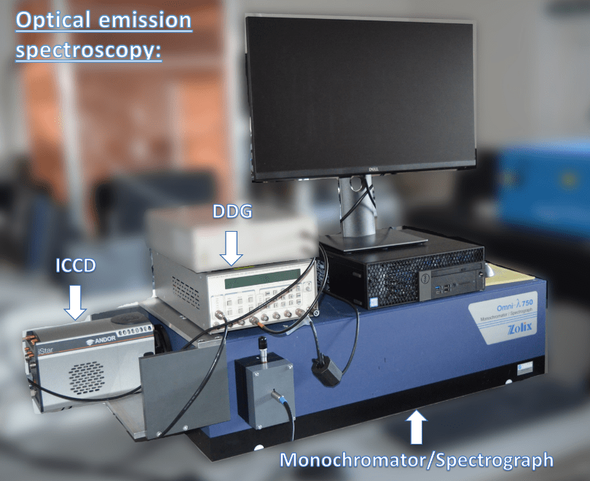
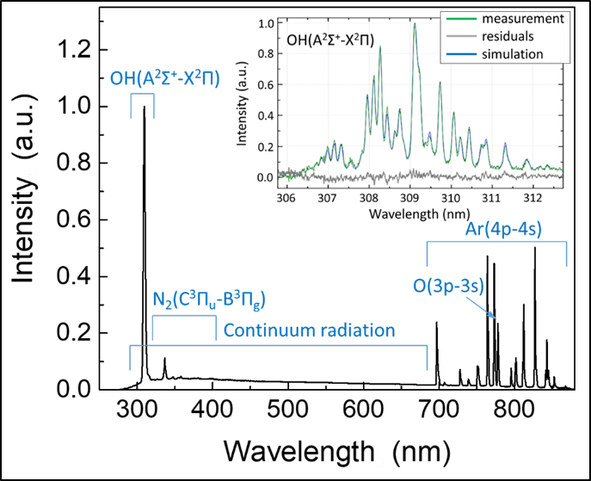
Figure. Overview of the OES spectrum of an Ar plasma at a power of 65 W. The inset shows the best fit of the measured and simulated OH (A-X) bands corresponding to a gas temperature T = 394 ± 10 K.
UV/VUV optical emission spectroscopy with absolute calibration
This technique is used to determine the gas composition and UV/VUV flux.
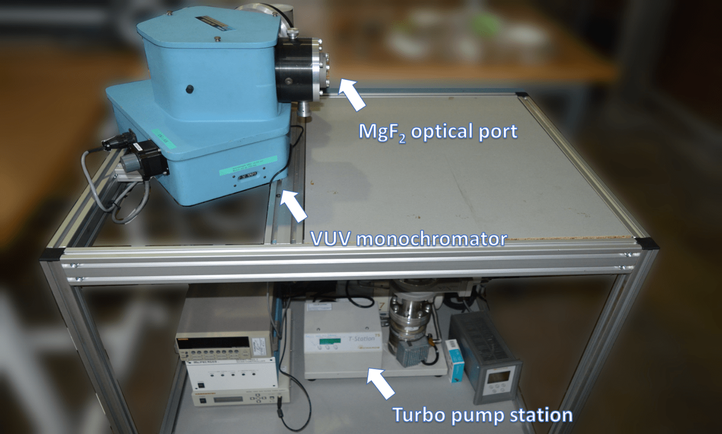
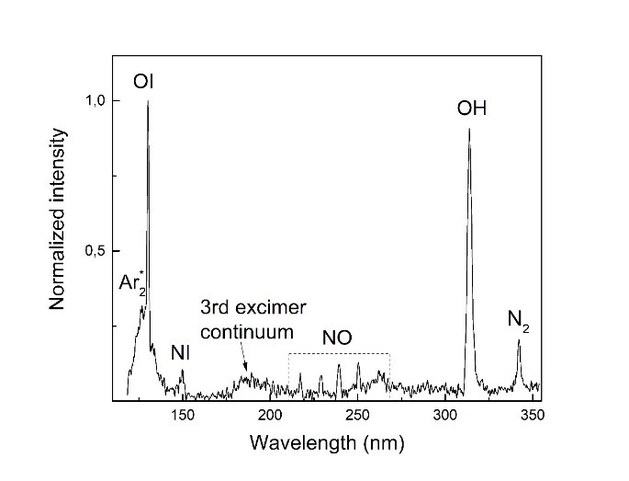
UV/VUV spectroscopy is used to measure the part of plasma emission spectra below 300 nm. As a type of emission spectroscopy, it is also a passive diagnostic technique that detects UV photons generated in the discharge. The UV signal is collected directly by a projection of the radiation to a monochromator which is typically pumped to low pressure or purged with He gas to avoid strong UV photons absorption. Consequently, the spectrum is registered using a PMT tube with a scinstilator. The optical emission spectra can be used to determine gas phase composition and can be calibrated in absolute units to evaluate the photons flux. Additionally, in RUPT, the UV/VUV system can be coupled with a D2 calibrated light source and used to measure the absorption of UV/VUV photons in the plasma and so to detect main species in-situ, including OH, H2O2, NO, NO3, O3 and singlet oxygen.
Facilities:
Spectrometer: Monochromator McPherson 0.3 m with turbo-pumping station
Detector: UV-enhanced Hamamatsu PMT
Detection range: 115-500 nm with MgF2 windows
Detection range: 30 nm- 500 nm windowless configuration
Spectrometer: Spectrograph Horiba iHR550
Camera: back-illuminated CCD
Detection range: 200-1100 nm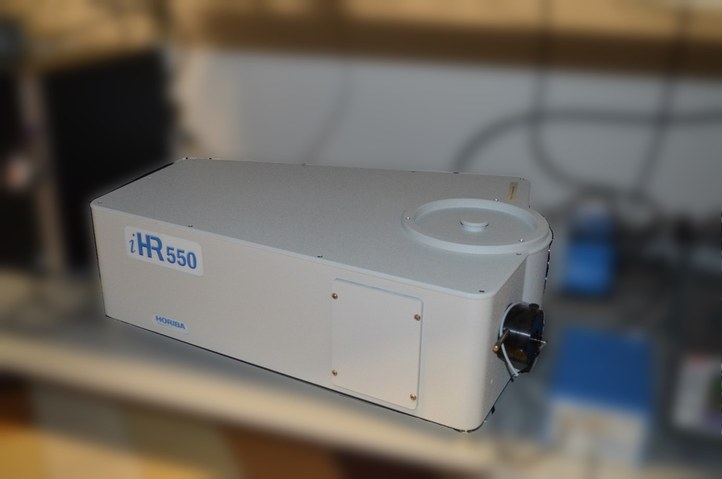
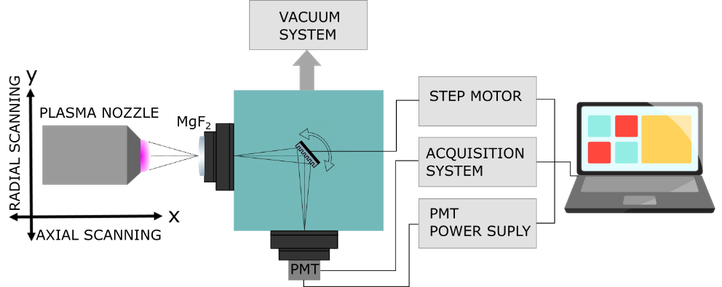
Figure. UV spectrum emitted from an atmospheric pressure plasma jet generated in 3 standard liters per minute at a power of 30W and a distance of 5 mm from the window
FTIR Spectrometer: absolutely calibrated, in-situ measurement optical bench
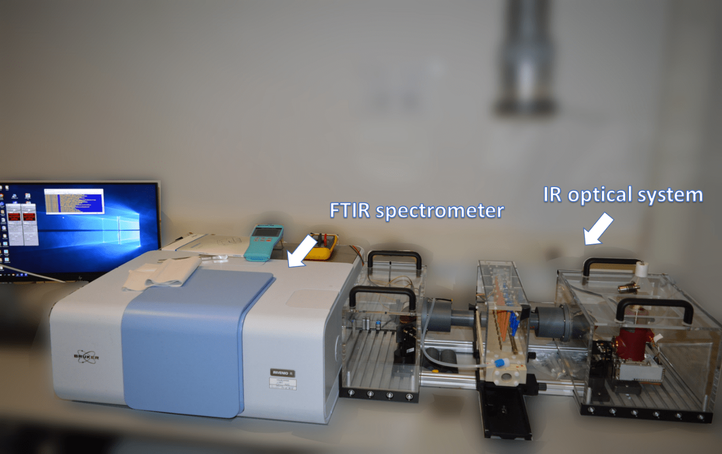
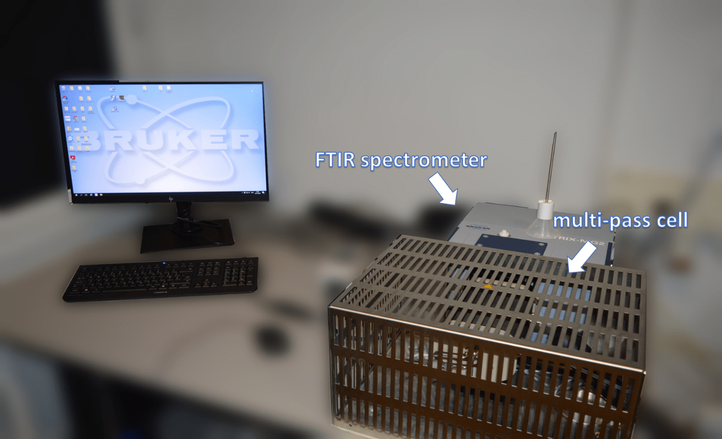
Many species produced by electrical discharges can be detected by absorption spectroscopy in the IR region. The FTIR method of detection has a very high sensitivity and can be used to measure many different components of the plasma gas. FTIR systems available in RUPT are also calibrated in absolute units allowing to study plasma initiated chemistry in the gas phase both qualitatively and quantitatively. The facility of RUPT includes 4 FTIR units for in-line analysis of the products. The Matrix system is the most advanced one as it has an integrated 5m long absorption cell and it is calibrated for the mainly occurring plasma components. Additionally, an in-situ plasma measurement FTIR system is also available in the team that allows studying the kinetics of plasma species generation directly in the plasma reactor.
Facilities
FTIR spectrometer: Invenio Bruker with an in-situ absorption cell
Gas cell: an in-situ (up to 10 cm) absorption cell
Resolution: better than 4 cm-1 in in-situ configuration
FTIR spectrometer: Matrix Bruker
Gas cell: an absolutely calibrated 5 m multipass cell
Resolution: 0.2 cm-1
Dr. Anton Nikiforov (Anton.Nikiforov@UGent.be) and Prof. Nathalie De Geyter (Nathalie.DeGeyter@UGent.be).
